


MARKETSVisualizing S&P 500 Performance in 2022, by SectorPublished 1 day ago on November 1, 2022
By Jan Varsava green checkmark iconFeatured Creator
Article/Editing:
Tessa Di Grandi
Omri Wallach
Tweet
Share
Share
Reddit
Email
Visualizing S&P 500 Performance in 2022, by Sector
Tracking indexes over the course of a year reveals a lot about market trends and sentiment. The S&P 500’s performance over the course of 2022 is a great example.
Throughout the year, inflation rates have remained high and interest rates have likewise been climbing around the world. Accompanied by the looming threat of a recession, some sectors have been hit harder than others.

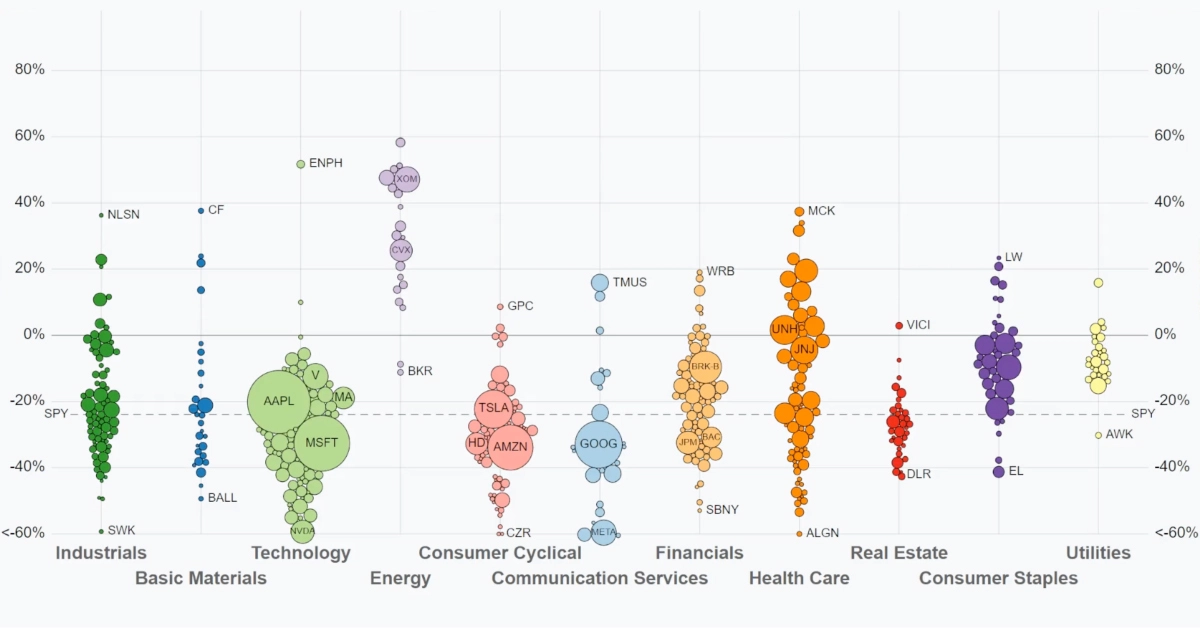
The above visualization from Jan Varsava shows U.S. dividend-adjusted stock performance for each company in the S&P 500 index in 2022, from the start of the year through the end of September.
S&P 500 Performance (Jan 1 to Sep 30, 2022)
In 2022, the S&P 500 index dropped -23.9% through the end of September. Let’s take a look at some of the major trends from this year’s stock market.
S&P 500 Sector Performance 2022 Q1–Q3
Energy +30.71%
Utilities -8.58%
Consumer Staples -13.52%
Health Care -14.15%
Industrials -21.72%
Financials -22.41%
Basic Materials -24.90%
Consumer Cyclical -30.32%
Real Estate -30.43%
Technology -31.93%
Communication Services -39.43%
Winners
The energy sector has been the noticeable standout and performed significantly well since the beginning of the year, as sanctions surrounding Russia impacted oil and gas supplies resulting in sharp price increases.
Top performing energy stocks as of September 30th, 2022 included Occidental Petroleum (OXY) up 112% year to date (YTD), and Marathon Petroleum (MPC) which rose 52% YTD.
Traditional defensive sectors such as healthcare, consumer staples, and utilities, although down for the year, also performed better than the overall index.
Losers
Growth stocks in both technology and communication services underperformed since the beginning of this year, as the value of future earnings were impacted by rising interest rates increasing the cost of capital.
Real estate, consumer cyclical (or consumer discretionary), and materials also underperformed compared to the overall index.
The trends are reflective of the fact that value stocks like energy and healthcare historically outperform growth stocks during periods of rising rates, though there are many varying factors that can alter performance.
Major Shifts in Q4
But as October has shown, the market is far from settled.
Lower-than-expected earnings and overspending caused Meta Platforms, Inc. (META) to drop 24% over five days and Amazon to drop 13%.
And the final impact of rising interest rates have yet to be fully felt, though indexes generally fare well in the year following. Since 1927, the average S&P 500 return sits at around 11.5% in the 12 months following peak inflation.
green check mark icon
This article was published as a part of Visual Capitalist’s Creator Program, which features data-driven visuals from some of our favorite Creators around the world.


")


