


MARKETSCharted: Market Volatility at its Lowest Point Since 2020Published 1 week ago on September 20, 2023
By Dorothy Neufeld
Graphics/Design:
Pernia Jamshed
Subscribe to the Advisor Channel free mailing list for more like this
Market Volatility at its Lowest Point Since 2020
Market Volatility at its Lowest Point Since 2020
This was originally posted on Advisor Channel. Sign up to the free mailing list to get beautiful visualizations on financial markets that help advisors and their clients.

Market volatility has been remarkably low in 2023, apart from the brief shock following the failure of Silicon Valley Bank earlier this year.
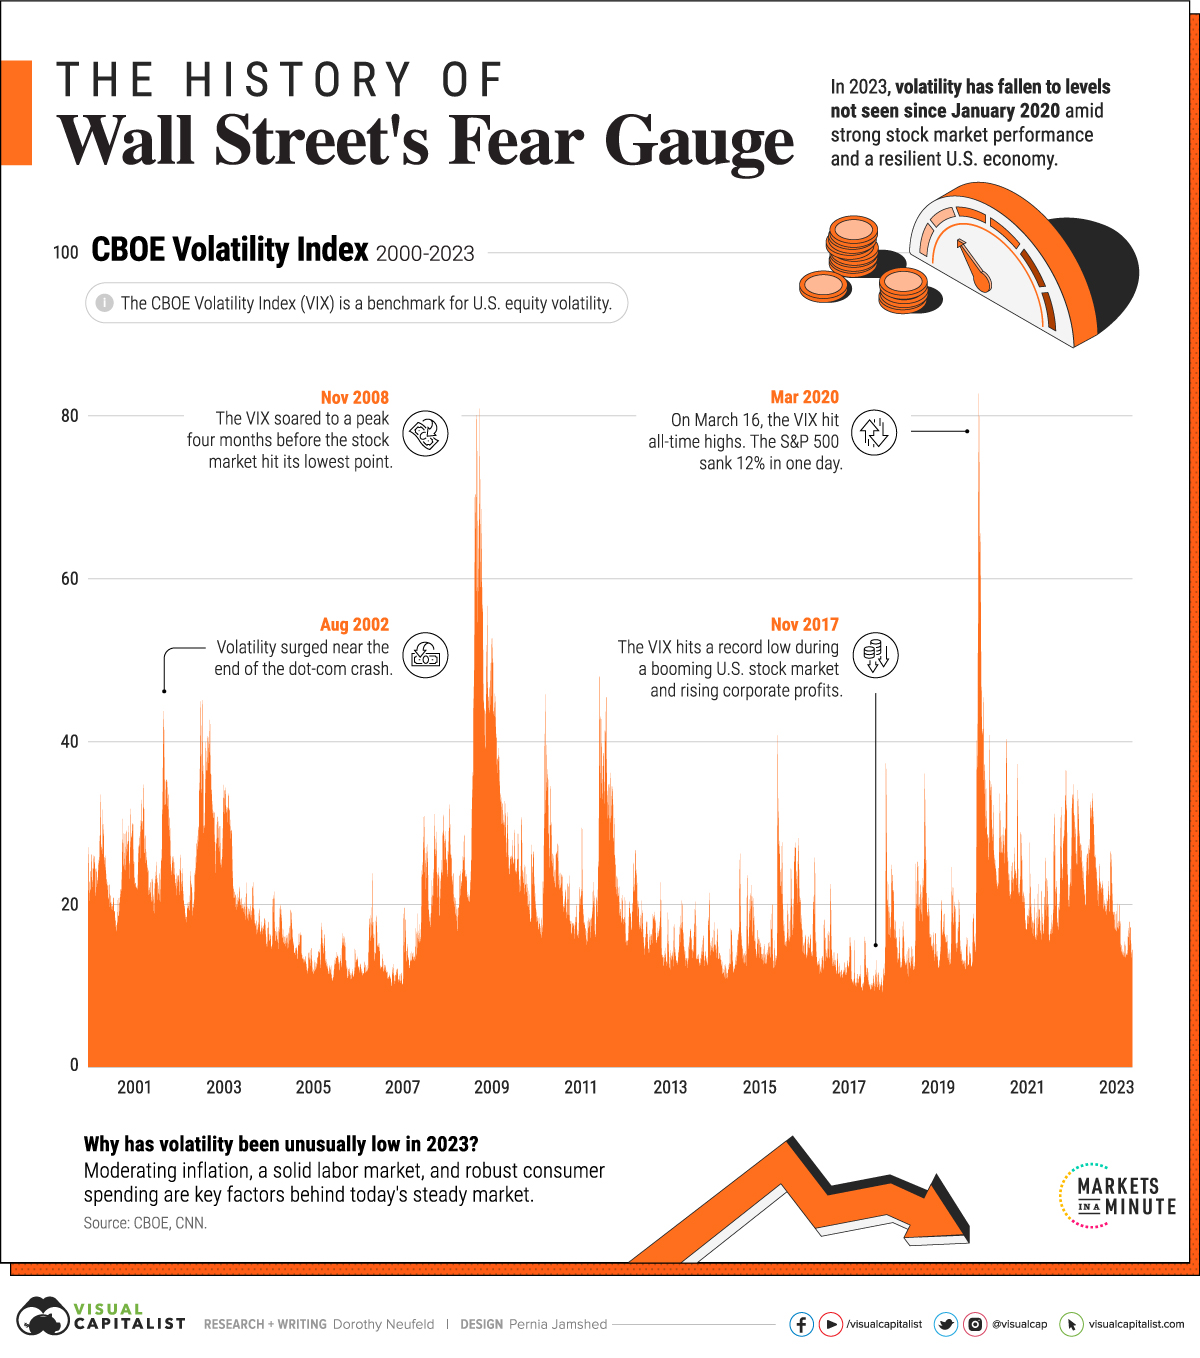
In fact, the CBOE Volatility Index (VIX)—a primary gauge for measuring U.S. equity volatility—has fallen to lows not seen since before the pandemic.
This graphic shows how today’s market volatility compares to the last two decades, and the factors that may explain its steadiness, based on data from CBOE.
How is Market Volatility Measured?
The most widely used index to track market volatility is the VIX.
In short, it measures the market’s expectation for price changes in the S&P 500. When investor uncertainty is high, the VIX spikes. For this reason, it serves as a barometer of fear in the market and often has a negative correlation to returns. For instance, when the VIX hit a peak on March 16, 2020, the S&P 500 fell 12% in one day.
Market Volatility: All-Time Highs and Lows
To put today’s market volatility in context, here are the market’s peak periods of volatility, through highs and lows:
Date VIX All-Time Highs S&P 500 Daily % Change
Mar 16, 2020 82.7 -12.0%
Nov 20, 2008 80.9 -6.7%
Oct 27, 2008 80.1 -3.2%
Oct 24, 2008 79.1 -3.5%
Mar 3, 2020 76.5 -2.8%
We can see in the above chart that the VIX skyrocketed in 2020 and 2008 at the height of recession fears.
By contrast market volatility hit all-time lows during 2017, when corporate profitability was high and the S&P 500 was in the middle of the second-longest bull run in history:
Date VIX All-Time Lows S&P 500 Daily % Change
Nov 3, 2017 9.1 +0.3%
Jan 3, 2018 9.2 +0.6%
Oct 5, 2017 9.2 +0.6%
Jan 4, 2018 9.2 +0.4%
Jan 5, 2018 9.2 +0.7%
When investors have muted reactions to the market’s outlook, often market volatility is lower—reflecting mixed reactions to the market instead of a unanimous, surprise reaction to economic data or other factors that could sway investor behavior.
2023’s Volatility in Context
In September, the VIX declined to 12.8, the lowest point since January 2020. Since then, it has hovered near these levels as investors scale back recession fears, and factor in the likelihood of the U.S. economy achieving a soft landing. To date, the S&P 500 is up almost 17%.
Many factors are influencing the market’s relative calmness. Inflation has been moderating, falling at 3.7% in August, down from a peak of 9.1% seen in June last year.
Labor market strength has also played a key role. The unemployment rate hovers near five-decade lows, and wage growth remains above historical averages at 4.3% annually as of August.
Despite 11 interest rate hikes since March 2022, consumer spending remains strong, although savings have declined considerably over the year. Household spending makes up roughly two-thirds of U.S. GDP, a key driver of economic output.
Together, these factors, among others, are influencing investor sentiment. Some may argue that investors are complacent as economic data could be weakening, but so far the resilience of the economy is supporting lower market volatility.

 to Change Company Address")


