


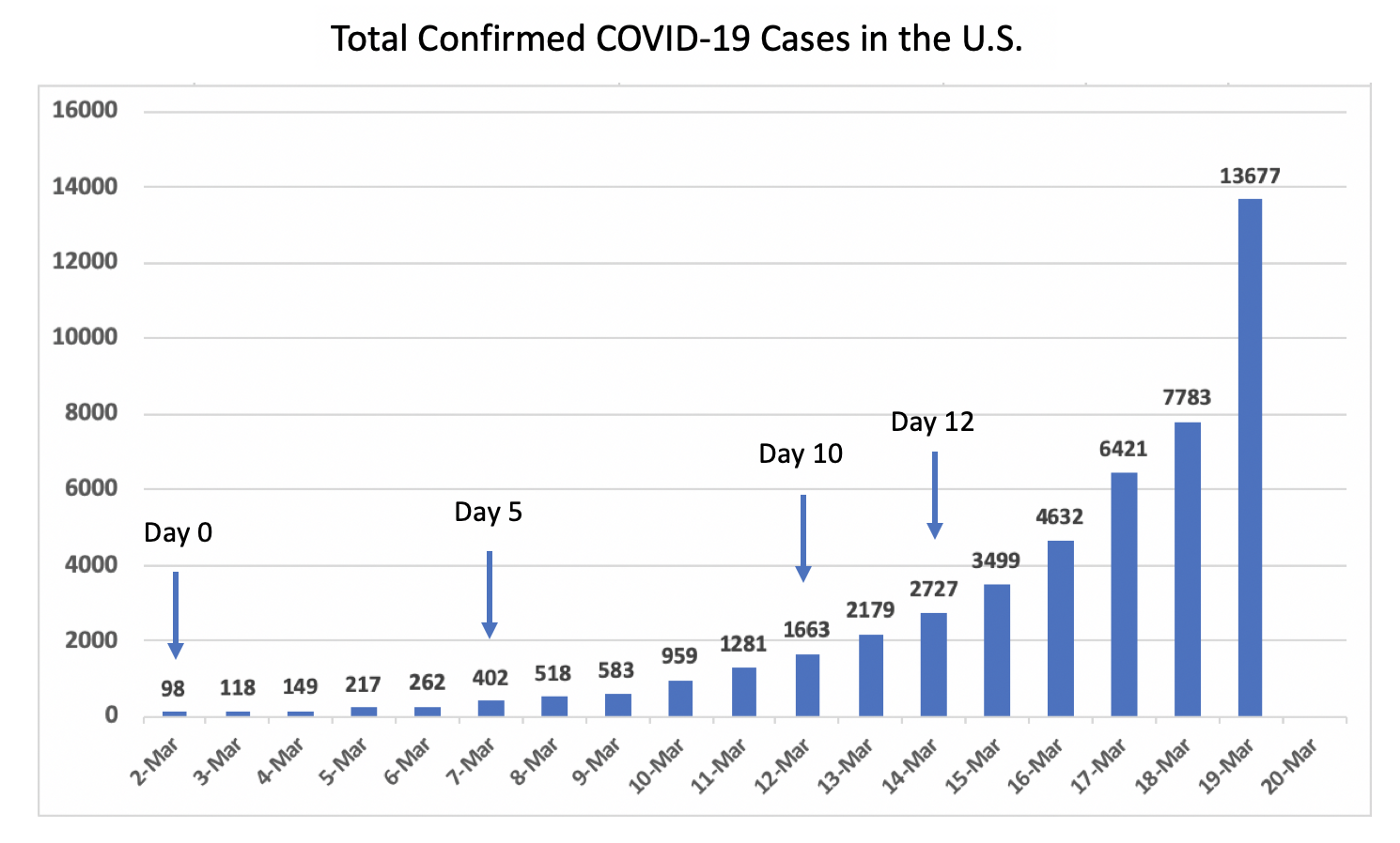
Today, the official total number of confirmed COVID-19 cases in the U.S. is 13,677. I believe the actual number of infections is closer to 1.25 million, and here is why.
I work as an urgent care physician at the Palo Alto Medical Foundation Urgent Care in Palo Alto, CA, where I help run our outdoor drive-thru clinic for patients experiencing respiratory symptoms.
This morning I called a patient — whom I will call Jack — to let him know about his positive COVID-19 result. I had seen him five days ago in the drive-thru clinic. I remember Jack to be in his 40s. He had recently returned from a family vacation in Italy and had been experiencing mild but common COVID-19 symptoms — low-grade fever, dry cough, and sore throat — for the past two days (Patient’s demographic and travel history changed to protect patient privacy).
I reached Jack on the phone on the first try, and let him know his test had come back positive. I went through my now familiar routine for positive COVID-19 results. “Are you feeling better?” “Please continue to isolate yourself.” “Please reach out to us if you have worsening symptoms such as shortness of breath or profound fatigue.”

Afterwards, as I prepared to notify the local public health department of Jack’s test result, it suddenly dawned on me that his result will be included in today or tomorrow’s tally of new COVID-19 cases, even though it had been 5 days since his test and 7 days since his symptom onset.
So I made a timeline of Jack’s COVID-19 history with the following assumptions based on published scientific data and my own experience:
- A typical incubation period of COVID-19 (5 days), and
- A typical turnaround time for COVID-19 testing today in Northern California in commercial labs (5 days)
This is a plausible timeline for Jack’s COVID-19 infection and illness course:
- Day 0: Exposure and infection
- Day 5: Symptoms begin
- Day 7: Jack presents to clinic, COVID-19 test is performed and sent to laboratory
- Day 12: Test result returns positive and the local health department is notified
In other words, Jack’s positive test result today reflects his infection approximately 12 days ago.
—
DELAY BETWEEN INFECTION AND CASE REPORTING
Let’s start with total confirmed cases in the United States so far.


As you can see, between March 2nd and March 14, the number of total confirmed cases in the U.S. has been doubling every 2.5 days, or quadrupling every 5 days (I have marked 3/2 as Day 0 to illustrate this point).
Yet, from Jack’s case above, we know that there is a 12 day delay between infection and case reporting. In other words, 2,727 cases that were reported on March 14 (Day 12) represent infections that have happened up until March 2nd (Day 0).
I wanted to ensure that my assumptions on the incubation period, the time from symptom onset to testing, and the testing turnaround time are in the ballpark of what others are seeing around the country, so I reached out to a few of my colleagues around the country.
Though there are some variations in the testing turnaround time, for the most part, all colleagues thought the 12 day delay between infection and case reporting was a reasonable estimation.
Where we think we are today, is in fact where we were 12 days ago. If we assume that the cases are increasing at the same exponential rate as they have been, this means 28 times more people have infections than what is reported*. In other words, 2,727 cases reported on March 14 reflect infections in March 2, and 3,499 cases from March 15 reflect active cases from March 3, and so on, and so forth.
(*For those interested in the calculation, a 2.5 day doubling rate represents a 1.32x increase in the number of cases each day. 1.32 to the 12th power gives you 27.85. This is equivalent to shifting the graph left by 12 days.)


When we adjust for the infection-to-case-reporting delay, we get 503,000 projected total cases today.
—
FOR EVERY CONFIRMED CASE, THERE ARE MANY MORE UNCONFIRMED CASES OUT THERE
Data from South Korea suggest that for every symptomatic case, there are many more asymptomatic cases (especially young people) that are walking around with mild or no symptoms. Another study estimates that in Wuhan, China, prior to the travel restriction, 86% of all cases were undocumented, which roughly translates into: only 1 out of 7 infections were confirmed by testing.
Today in the U.S., with shortages of testing kits, we have made a decision NOT to test young and healthy patients presenting with symptoms compatible with COVID-19. In fact, we discourage them from leaving their house to get evaluated in person, let alone get tested for COVID-19, unless they report any concerning symptoms such as shortness of breath, profound fatigue, or unresolving fever. Today, I am instructed to reserve testing for only those who are most likely to experience severe complications from COVID-19, or health care workers in which testing has a significant impact on their ability to get back into the frontline.
In short, I know that for every confirmed case, there are many more undiagnosed and undocumented cases in the community. Based on my experience, I think it is fair to extrapolate from the previously quoted study from Wuhan and assume that for every confirmed case there are 6 undiagnosed infections in the community. In other words, every confirmed case represents 7 infections.
To get a more realistic picture of where America stands in this COVID-19 pandemic today, we must account for BOTH (1) the delay between when an infection happens and when it is reported AND (2) the prevalence of undocumented, unconfirmed cases.
In other words, we first multiply the confirmed cases by 28 to account for the delay, than multiply it again by 7 to account for undocumented cases (i.e. by 196).


So when we adjust for the infection-to-case-reporting delay AND undiagnosed cases, we get 3.5 million projected total cases in the U.S. today.
—
BUT WHAT ABOUT SOCIAL DISTANCING AND FLATTENING THE CURVE?
I know what some of you may be thinking.
What about social distancing and lockdown that happened in the last week or so? Wouldn’t that significantly slow down the rate of transmission?
Acceptance and practice of social distancing still do not seem universal. In areas that are heavily affected by COVID-19 such as New England, New York, and the West Coast, schools have been closed for more than a week. Employees of major tech companies have been working from home for more than 2 weeks. On the other hand, in places like Texas, the statewide school closing did not happen until yesterday. In Florida, a beach was packed as recently as 4 days ago.
In short, I am not sure how effective social distancing has been across the country in reducing transmission of COVID-19. It certainly hasn’t stopped new infections altogether, but I believe the doubling time is now likely to be longer than 2.5 days. So to adjust for the impact of social distancing, I have used the doubling time of 4 days for the rate of increase since March 10, which is around when “flatten the curve” started trending in social media.


My best guess is that there are approximately 1.25 million people with COVID-19 infections in the U.S. today. That is approximately 90 times today’s confirmed cases. More than half of these patients have acquired their infection within the last 5 days and are still in the incubation period, yet to become symptomatic.
Obviously there is a huge error bar on this estimation. The real number may be 3.5 million people, or it may be 350,000 people. One thing we know for sure is that the total number of infections in the U.S. today is MUCH HIGHER THAN the reported number of 13,677.
*This article was written on the morning of March 20, 2020.


