


GREENVisualizing Mismanaged Plastic Waste by CountryPublished 2 days ago on November 10, 2022
By Christina Kostandi
Article/Editing:
Govind Bhutada
Tweet
Share
Share
Reddit
Email
mismanaged plastic waste around the world by country
▼ Use This Visualization
Visualizing Mismanaged Plastic Waste by Country
Plastic is one of the most useful materials around, but its proliferating use has created a ballooning heap of plastic waste, with more than 350 million tonnes generated each year.
Only a fraction of plastic waste is recycled, and about one-fifth ends up in the mismanaged category, meaning that it is dumped or littered without proper waste management practices. Mismanaged plastic waste threatens the land and marine environments, and most of it doesn’t decompose, polluting the environment for hundreds of years.

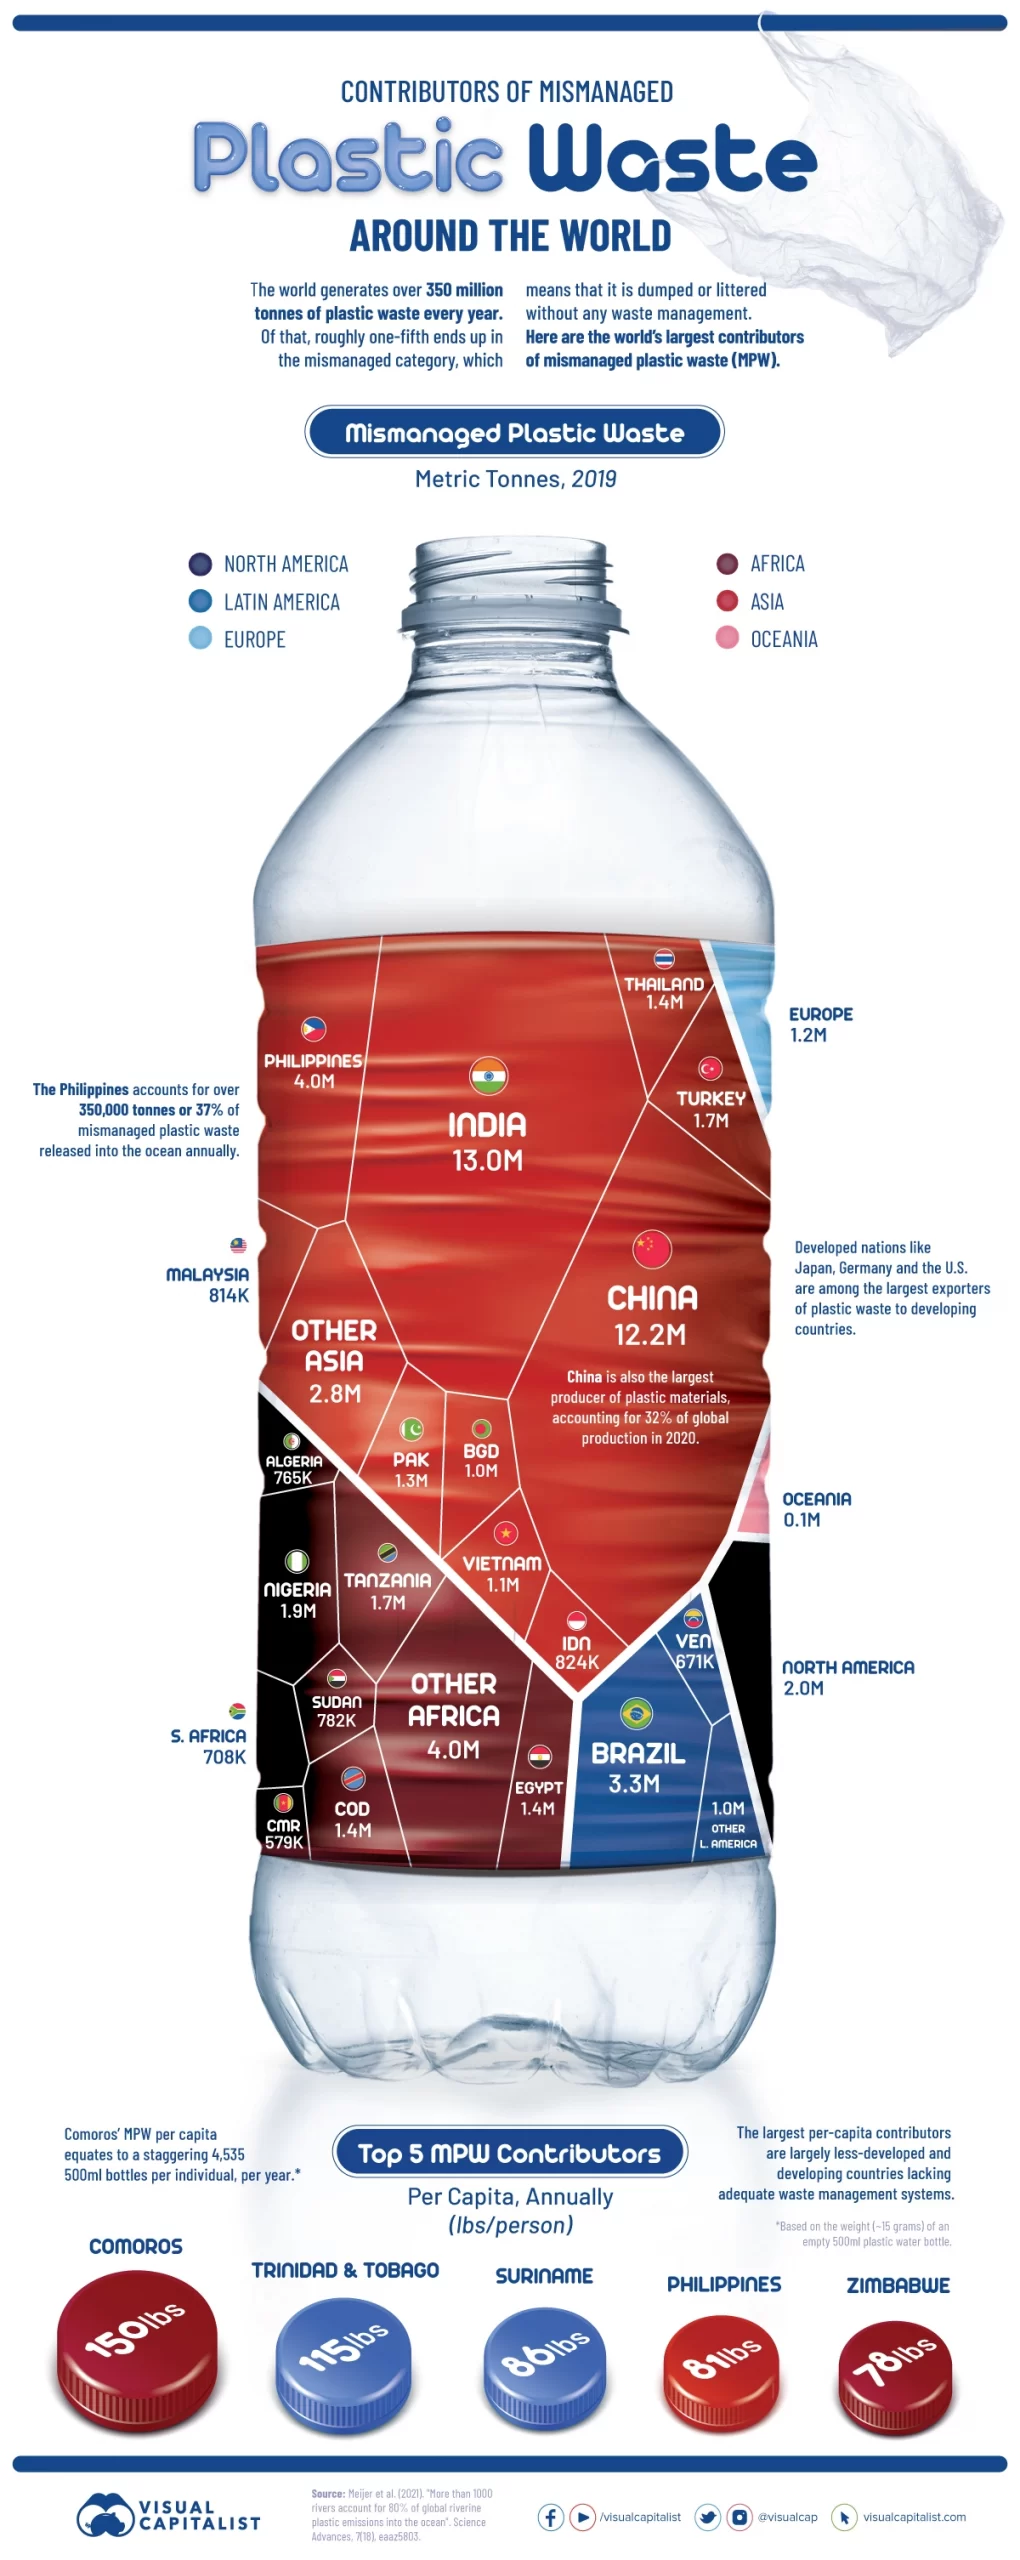
The above infographic visualizes the largest contributors of mismanaged plastic waste in 2019, based on data from a study by Meijer et al. published in the Science Advances journal.
The Largest Contributors of Mismanaged Plastic Waste
Asian countries account for the majority of global mismanaged plastic waste (MPW), and many of the top plastic-emitting rivers are concentrated in the region.
India and China are the only countries to account for over 10 million tonnes of MPW, although that could partly be driven by their sheer population numbers.
Search:
Country/Region MPW created in 2019 (tonnes) % of total
India 🇮🇳 12,994,100 21%
China 🇨🇳 12,272,200 20%
Philippines 🇵🇭 4,025,300 7%
Brazil 🇧🇷 3,296,700 5%
Nigeria 🇳🇬 1,948,950 3%
North America 🌎 1,927,484 3%
Tanzania 🇹🇿 1,716,400 3%
Turkey 🇹🇷 1,656,110 3%
Egypt 🇪🇬 1,435,510 2%
DR Congo 🇨🇩 1,369,730 2%
Total 61,773,700 100%
Showing 1 to 10 of 24 entriesPreviousNext
Generally, the top countries in the above table are developing economies that tend to have inadequate waste management infrastructure.
The Philippines is the third-largest contributor and accounts for 37% of all MPW released into the ocean at over 350,000 tonnes per year. Solid waste management remains a major environmental issue in the Philippines. The country recently closed down 335 illegal dumpsites to encourage the use of sanitary landfills and proper waste segregation.
The three continents of North America, Europe, and Oceania together account for just 5% of global mismanaged plastic waste. However, it’s important to note that these figures do not reflect the amount of waste that is exported overseas, and many rich nations are known to export some portions of their waste to poorer nations.
The State of Plastic Waste Trade
In 2019, the Philippines famously shipped back 69 containers of dumped garbage back to Canada, joining other nations in rejecting waste from rich countries.
Until 2017, China was the largest importer of overseas plastic waste, accounting for roughly 50% of global plastic waste imports. Then, it imposed an import ban on almost all types of plastic waste, resulting in a decline in the overall global plastic scrap trade.
In 2021, global plastic waste imports were just over one-third of 2017 levels. However, countries including Malaysia, Indonesia, and Vietnam have been importing more plastic waste since China’s ban, slightly offsetting the impact.
Mismanaged Plastic Waste Per Capita
On a per capita basis, the archipelago of Comoros in East Africa tops the list. Its per capita MPW is equivalent to over 4,500 empty 500ml plastic bottles per person, per year.
Country MPW per capita GDP per capita (2021, current US$)
Comoros 🇰🇲 150lbs (68kg) $1,495
Trinidad and Tobago 🇹🇹 115lbs (52kg) $15,243
Suriname 🇸🇷 86lbs (39kg) $4,836
Philippines 🇵🇭 81lbs (37kg) $3,549
Zimbabwe 🇿🇼 78lbs (35kg) $1,737
While there isn’t much information available on waste management in Comoros, it is one of the world’s least-developed nations. In fact, household consumption accounts for almost 100% of its annual gross domestic product.
Trinidad and Tobago is an outlier due to its high-income status, but a lack of waste segregation among households, alongside inefficient waste management systems, contributes to its high per capita figure.
The Impact of Plastic Waste
Plastic waste has various negative implications for the environment, especially as it can take hundreds of years to decompose.
Millions of tonnes of plastic waste flows into the oceans every year, accounting for at least 85% of all marine garbage. This poses a major threat to aquatic life because fish and other organisms can get entangled in plastic waste and ingest plastics.
On land, plastic waste threatens the quality of the soil and its surrounding ecosystem. Additionally, burning plastic waste releases toxic particles that have a detrimental impact on air quality.
If current trends continue, over 12 billion tonnes of plastic waste is expected to end up in landfills by 2050. Although recycling rates are expected to improve, increasing the availability of adequate waste management systems will be important in preventing plastic waste from entering the environment.


